SOLD! 537 DEAD TIMBERS ROAD LAKE MARTIN

dead timbers lake home

537 DEAD TIMBERS ROAD
LAKE MARTIN

SOLD! REPRESENTED SELLER

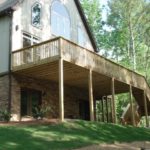
Craftsman Lake Home on Year Round Water. Five bedrooms, two dens. Lots of room for parking. Even a motorhome or two!

Very desirable area near restaurants and marinas.

Stainless steel appliances, granite countertops. Wood floors in living room, kitchen, dining and master bedroom. Tile in bathrooms and laundry room.

Two 10 x 40 covered decks on lakeside.

ANOTHER LAKE MARTIN HOME SOLD BY

DON FULLER
FULLER REALTY LAKE MARTIN

CALL OR TEXT 256.675.0067
EMAIL DON

SOLD! 309 BEACH ISLAND STILLWATERS

309 beach island

309 BEACH ISLAND
STILLWATERS AT LAKE MARTIN

SOLD! REPRESENTED SELLER

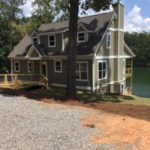
One of a kind mountain home in quiet area of Stillwaters with a lake view. Big screened porch, huge deck and covered patio on lake side. Tall vaulted ceilings, custom two sided fireplace, craftsman style moldings, wood floors etc. Master on main level with two bedrooms upstairs. Unfinished basement with lots of potential.

Near Marina and ship store and short golf cart ride to tennis courts, pool, play ground, StillWaters Golf and Copper’s Grill.

ANOTHER LAKE MARTIN HOME SOLD BY

DON FULLER
FULLER REALTY LAKE MARTIN

CALL OR TEXT 256.675.0067
EMAIL DON

Lake Martin waterfront’s August median sales price sees 14 percent boost from 2017

46 forrest way lake martin al

By: ACRE Research

Sales: According to the Lake Martin Association of Realtors, waterfront-area residential sales totaled 36 units during August, down 2.7 percent from 37 sales in the same month a year earlier. However, August sales were up 24.1 percent compared to 29 sales in July. Results were 2.3 percent above the five-year August average of 35 sales.

For all waterfront-area home sales data, click here.

Inventory: Homes listed for sale in the waterfront area during August totaled 314 units, an increase of 27.1 percent from August 2017’s 247 units, and an increase of 6.1 percent from July 2018’s 296 units.

Pricing: The Lake Martin waterfront median sales price in August was $481,562, an increase of 14.4 percent from one year ago and a decrease of 29.2 percent from the prior month. This direction is inconsistent with historical data (2013-17) indicating that the August median sales price on average increases from July by 32.2 percent. The differing sample size (number of residential sales of comparative months) can contribute to statistical volatility, including pricing. ACRE recommends consulting with a local real estate professional to discuss pricing, as it will vary from neighborhood to neighborhood. The average number of days spent on the market (DOM) by waterfront homes that sold during August was 224 days, an increase of 29.5 percent from 173 days in August 2017, and an increase of 62.3 percent from 138 days in July.

Forecast: August sales were six units, or 14.3 percent, below the Alabama Center for Real Estate’s (ACRE) monthly forecast. ACRE projected 42 sales for the month, while actual sales were 36 units. ACRE forecast a total of 246 residential sales in the waterfront area year-to-date, while there were 213 actual sales through August.

ACRE’s statewide perspective: Residential sales in Alabama continued to grow during the late summer of 2018. Total residential sales during August increased 3.5 percent year-over-year from 5,664 to 5,862 closed transactions. Year-to-date through August, statewide residential sales are up 6.6 percent from 39,594 one year ago to 42,209. Home price appreciation in the state also continues its upward trajectory. The median sales price in August increased 2.9 percent from $158,059 to $162,711, while the year-to-date median sales price is up 4.9 percent from 2017. Although nationwide inventory levels are starting to stabilize, Alabama’s residential inventory decreased by 11.4 percent from one year ago. Low inventory levels were a major factor contributing to rising sales prices during August. With low inventory levels, it is not surprising to see homes selling more quickly than in previous years. Homes selling in Alabama during August spent an average of 95 days on the market, an improvement of 22 days from 2017.

NAR’s national perspective: During August, nationwide sales volume for existing homes increased 0.7 percent year-over-year from 535,000 to 539,000 closed transactions. According to Lawrence Yun, chief economist for the National Association of Realtors, “Strong gains in the Northeast and a moderate uptick in the Midwest helped to balance out any losses in the South and West, halting months of downward momentum. With inventory stabilizing and modestly rising, buyers appear ready to step back into the market.”

The Lake Martin Waterfront Residential Monthly Report is developed in conjunction with the Lake Martin Area Association of Realtors to better serve area consumers.
Lake Martin area August home sales increase 6.7 percent from 2017

By: ACRE Research

Sales: Lake Martin area residential sales totaled 80 units during August, up 6.7 percent from 75 sales in the same month a year earlier. August sales were up 35.6 percent compared to 59 sales in July. Results were 31 percent above the five-year August average of 61 sales. Two more resources to review: Quarterly Report and the Annual Report.

Inventory: Homes listed for sale in the Lake Martin area during August totaled 569 units, an increase of 32.3 percent from August 2017’s 430 units, and an increase of 13.6 percent from July 2018’s 501 units. August months of supply totaled 7.1 months, an increase of 24.1 percent from August 2017’s 5.7 months of supply. However, August’s months of supply decreased from July’s 8.5 months of supply.

Pricing: The Lake Martin area median sales price in August was $238,250, a decrease of 5.8 percent from one year ago and a decrease of 3.5 percent from the prior month. This direction is inconsistent with historical data (2013-17) indicating that the August median sales price on average increases from July by 24 percent. The differing sample size (number of residential sales of comparative months) can contribute to statistical volatility, including pricing. ACRE recommends contacting a local real estate professional for additional market pricing information. The average number of days on the market (DOM) for homes selling in August was 163 days, a decrease of 7.9 percent from 177 days in August 2017 and an increase of 23.5 percent from 132 days in July.

Forecast: August sales were four units, or 5.3 percent, above the Alabama Center for Real Estate’s (ACRE) monthly forecast. ACRE projected 76 sales for the month, while actual sales were 80 units. ACRE forecast a total of 473 residential sales year-to-date, while there were 459 actual sales through August.

perspective: Residential sales in Alabama continued to grow during the late summer of 2018. Total residential sales during August increased 3.5 percent year-over-year from 5,664 to 5,862 closed transactions. Year-to-date through August, statewide residential sales are up 6.6 percent from 39,594 one year ago to 42,209. Home price appreciation in the state also continues its upward trajectory. The median sales price in August increased 2.9 percent from $158,059 to $162,711, while the year-to-date median sales price is up 4.9 percent from 2017. Although nationwide inventory levels are starting to stabilize, Alabama’s residential inventory decreased by 11.4 percent from one year ago. Low inventory levels were a major factor contributing to rising sales prices during August. With low inventory levels, it is not surprising to see homes selling more quickly than in previous years. Homes selling in Alabama during August spent an average of 95 days on the market, an improvement of 22 days from 2017.

NAR’s national perspective: During August, nationwide sales volume for existing homes increased 0.7 percent year-over-year from 535,000 to 539,000 closed transactions. According to Lawrence Yun, chief economist for the National Association of Realtors, “Strong gains in the Northeast and a moderate uptick in the Midwest helped to balance out any losses in the South and West, halting months of downward momentum. With inventory stabilizing and modestly rising, buyers appear ready to step back into the market.”

Lake Martin area homes selling 24 days faster on average compared to a year ago

By: ACRE Research

Sales: Lake Martin area residential sales totaled 59 units during July, up 34.1 percent from 44 sales in the same month a year earlier. July sales were down 18.1 percent compared to 72 sales in June. Results were 15.6 percent above the five-year July average of 51 sales. Two more resources to review: Quarterly Report and the Annual Report.

Inventory: Homes listed for sale in the Lake Martin area during July totaled 501 units, an increase of 17.1 percent from July 2017’s 428 units, and an increase of 6.1 percent from June 2018’s 472 units. July months of supply totaled 8.5 months, a decrease of 12.7 percent from July 2017’s 9.7 months of supply. However, July’s months of supply increased from June’s 6.6 months of supply.

Pricing: The Lake Martin area median sales price in July was $247,000, a decrease of 19 percent from one year ago and an increase of 11.8 percent from the prior month. This direction is inconsistent with historical data (2013-17) indicating that the July median sales price on average decreases from June by .3 percent. The differing sample size (number of residential sales of comparative months) can contribute to statistical volatility, including pricing. ACRE recommends contacting a local real estate professional for additional market pricing information. The average number of days on the market (DOM) for homes selling in July was 132 days, a decrease of 15.4 percent from 156 days in July 2017 and a decrease of 10.2 percent from 147 days in June.

ACRE’s statewide perspective: Residential sales in Alabama continued to grow during the second quarter of 2018. Total residential sales increased 10.4 percent year-over-year from 16,450 to 18,157 closed transactions. Home price appreciation in the state also continues its upward trajectory, as the median sales price during the second quarter increased 4.3 percent year-over-year from $155,278 to $161,975. Mirroring national trends, statewide inventory decreased 9.4 percent from one year ago. Low inventory levels were a major factor contributing to rising sales prices during the second quarter. With low inventory levels, it is not surprising to see homes selling more quickly than in previous years. Homes selling in Alabama during the second quarter of 2018 spent an average of 98 days on the market, an improvement of 24 days from 2017.

NAR’s national perspective:  During June, nationwide sales volume for existing homes decreased 5 percent year-over-year from 600,000 to 570,000 closed transactions. According to Lawrence Yun, chief economist for the National Association of Realtors, “there continues to be a mismatch since the spring between the growing level of home buyer demand in most of the country in relation to the actual pace of home sales, which are declining. The root cause is without a doubt the severe housing shortage that is not releasing its grip on the nation’s housing market. What is for sale in most areas is going under contract very fast, and in many cases has multiple offers. This dynamic is keeping home price growth elevated, pricing out would-be buyers and ultimately slowing sales.”

The Lake Martin Residential Monthly Report is developed in conjunction with the Lake Martin Area Association of Realtors to better serve area consumers.