February sales on Lake Martin’s waterfront increase from January

46 forrest way lake martin al

By: ACRE Research

The Lake Martin waterfront median home sales price during February was $520,000, an increase of 48.6 percent from one year ago.

Click here to view or print the entire monthly report compliments of the ACRE Corporate Cabinet.

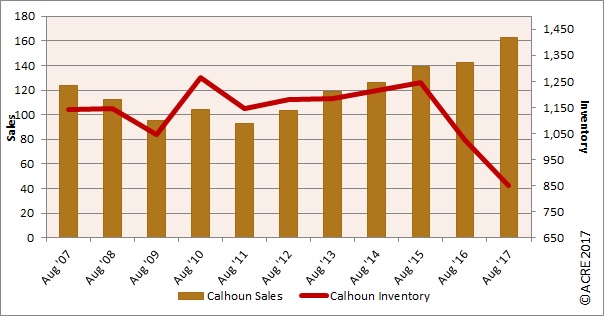
Sales: Lake Martin waterfront sales totaled 15 units during February, representing a 25 percent decrease from one year ago, when 20 waterfront units were sold. The 10-year peak for February waterfront sales was in 2017, when 20 units were sold, while the trough hit in 2010, with four units sold.

Forecast: February results were one unit or 6.3 percent below the Alabama Center for Real Estate’s monthly forecast. ACRE projected a total of 30 waterfront sales through February, while there were 28 actual sales.

Supply: The Lake Martin waterfront housing inventory in February was 206 listings, an increase of 17.7 percent from the previous month and a decrease of 16.9 percent from one year ago. This is consistent with historical data from 2013-17 indicating that February inventory on average increases from January by 16 percent.

Pricing: The Lake Martin waterfront median sales price during February was $520,000, an increase of 25.3 percent from the previous month and an increase of 48.6 percent from one year ago. Pricing will fluctuate from month to month because of changing composition of actual sales (lakefront vs. non-lakefront) and the sample size of data (closed transactions) being subject to seasonal buying patterns. ACRE recommends contacting a local real estate professional for additional market pricing information.

Demand: February waterfront sales increased 15.4 percent from the previous month. This is consistent with historical data indicating that February sales on average (’13-’17) increase from January by 19.6 percent. Waterfront homes selling in February averaged 189 days on the market, representing a 48.8 percent increase from one year ago. Waterfront homes on Lake Martin are currently selling 15 percent faster than the five-year average of 223 days on the market.

Seeking balance: There were 13.7 months of supply in February, up slightly from 13.5 months of supply last month and up from 12.4 months of supply one year ago. Restated, at the February sales pace, it would take 13.7 months to absorb the current inventory for sale. The market equilibrium (balance between supply and demand on a non-seasonally adjusted basis) is approximately 6 months.

Industry perspective: The 10-year treasury is a crucial indicator of economic expansion. As of March 1, 2018, the 10-year treasury stood at 2.88 percent, a slight increase from last month’s rate of 2.86 percent. Mortgage rates also experienced a slight increase recently as the current rate on a 30-year fixed-rate mortgage is 4.57 percent, up from 4.38 percent one month ago. As the economy continues to strengthen, people will have more money in their pockets with the intent to spend. This increase in spending will most likely create higher stock prices and lower bond prices. With this increase of confidence in the market, mortgage interest rates can be expected to increase.

The National Association of Home Builders (NAHB) produces economic analyses of the home-building industry based on government data. The Housing Market Index (HMI) depicts market conditions for the sale of new homes. The HMI ranges from 0 to 100; a rate greater than 50 represents good sales conditions.

The HMI in the South has stayed relatively steady in the past few months with a score of 73. However, the HMI is lower in some regions of the United States, such as the Northeast, which has a rate of 56. The West has a higher HMI of 77, and a better market for good housing conditions.

The Federal Housing Finance Agency uses the House Price Index (HPI) to measure the average price changes in repeat sales or refinancing on the same properties. The FHFA’s national HPI was up 6.7 percent from the previous year compared to Alabama, which has increased from the previous year by 5.6 percent. The HPI rose in all 49 states except for Mississippi.

Compared to the national housing market conditions, Alabama’s real estate market has been showing improvement. Although total residential sales in Alabama decreased 2.3 percent from January 2017, the statewide median sales price increased 2.3 percent from January 2017. Statewide, homes in Alabama are selling much more quickly than in recent years as the average days on the market decreased 19.6 percent from one year ago.

The Lake Martin Waterfront Residential Monthly Report is developed in conjunction with the Lake Martin Area Association of Realtors to better serve area consumers.

DON FULLER BROKER
FULLER REALTY LAKE MARTIN
CALL OR TEXT 256.675.0067
EMAIL DON

December sales on Lake Martin’s waterfront increase 44 percent from 2016

905 point windy lake martin al

By: ACRE Research

Sales: Lake Martin waterfront sales totaled 23 units during December, a 43.8 percent increase from the same period in 2016, when 16 units were sold. Total 2017 sales on the waterfront were up 15.9 percent from 2016. The 10-year peak for December sales in this area was in 2013, when 26 units were sold, while the trough hit in 2011, with four units sold.

Forecast: December results were eight units or 53.3 percent above the Alabama Center for Real Estate’s monthly forecast. ACRE’s 2017 sales forecast through December projected 269 closed transactions, while the actual sales were 349 units.

Supply: The Lake Martin waterfront housing inventory in December was 150 units, a decrease of 12.3 percent from December 2016 and 67.5 percent below the December peak in 2008 of 461 units. December inventory decreased by 20.6 percent from November.

Pricing: The Lake Martin waterfront median sales price during December was $327,000, a decrease of 29.7 percent from December 2016 and a decrease of 25.2 percent from the prior month. Pricing will fluctuate from month to month because of changing composition of actual sales (lakefront vs. non-lakefront) and the sample size of data (closed transactions) being subject to seasonal buying patterns. ACRE recommends contacting a local real estate professional for additional market pricing information.

Demand: December waterfront sales were equal to the prior month’s sales. Historical data indicates that December sales on average (’12-’16) decrease from November by 48.5 percent. Waterfront homes selling in December averaged 167 days on the market, representing a 0.6 percent decrease from 2016. Homes on Lake Martin are currently selling faster than the five-year average of 227 days on the market.

Seeking balance: For the month of December, the inventory-to-sales ratio declined 20.6 percent from 2016. It now stands at 6.5 months. Restated, at the December sales pace, it would take 6.5 months to absorb the current inventory for sale. The market equilibrium (balance between supply and demand on a non-seasonally adjusted basis) is approximately 6 months.

Industry perspective: “2017 ushered in with an outlook of uncertainty on the heels of the 2016 national elections, but 2017 went out with an exclamation punctuation mark of growth,” said KC Conway, director of research and corporate engagement at the Alabama Center for Real Estate (ACRE). Conway said 2017 “was the year we have waited a decade for since the onset of the 2006-2007 housing crisis. U.S. GDP turned in back-to-back quarters of more than 3 percent growth in Quarter 2 and Quarter 3; and 2017 will be the first year in a decade that the U.S. turned in an annual GDP growth rate north of 2 percent. It was just 1.7 percent in 2016. 2018 will see 2.5 to 3 percent GDP growth.

“Employment growth is a good-news story as well. The ADP National Employment Report is this economist’s go-to monthly jobs report as it is based on rich primary data – not a survey, as in the case of BLS jobs report. The January ADP report revealed more than 250,000 jobs created in the month of December (compared with 148,000 in the BLS year-end jobs report). ADP job growth for the trailing three months (more than 224,000 jobs), six months (more than 199,000 jobs), and 12 months (more than 212,000 jobs) were all at or above 200,000 jobs per month. This trend should continue through 2018.

“Heading into 2018, the more important questions to answer for Alabama Realtors are:

  • What do the real estate metrics look like?
  • Will home builders finally be confident enough to start more inventory?
  • Will the FED ruin the good times with more rate hikes in 2018?

“With respect to the real estate market conditions and home-builder confidence, the National Association of Home Builders (NAHB) Housing Market Index (HMI) is your best barometer of things to come. The HMI is a monthly survey of NAHB members to take their pulse on the single-family housing market and rate conditions for the sale of new homes over the coming six months. In December 2017, the HMI registered 74 — the second-best reading since 1985 and best since December 1998. A reading above 50 reflects growth. The December 2017 reading of 74 compares to a record low of just 8 in January 2010. We have come a long way since 2009-2010.

“With respect to home-building activity in Alabama during 2018, some perspective on 2017 is fruitful. In 2017, Alabama issued 13,200 permits in the January to November period – of which 11,200 were for single-family residences and 2,000 multifamily units. Breaking down the Alabama permit activity, Huntsville has overtaken Birmingham for the most total housing permits with 2,804 (2,422 single family versus 382 multifamily). The top five metropolitan statistical areas for housing permit activity during 2017 through November were:

  1. Huntsville with 2,804 total permits.
  2. Birmingham with 2,746 permits.
  3. Daphne-Foley with 1,699 total permits.
  4. Auburn with 1,292 total housing permits.
  5. Tuscaloosa with 976 total new permits.

“Finally, will the FED ruin the good times with too many rate hikes? In short, the answer is no. However, the FED is worth watching in 2018 as it is a new cast of characters led by a new chairman (Chairman Jerome Powell has yet to be confirmed by the Senate but is expected to take over in February or March from existing Chair Janet Yellen). The FED is not likely to depart from rate hikes in 2018 (expect three, maybe four, starting in March due to higher GDP and tighter labor markets). Communicate now with your prospective spring home buyers as the 10-Year Treasury is rising. It is already threatening a 2.6 percent level. Thirty-year mortgage rates will climb above 4 percent in 2018. New home builders can manage rate increases by curtailing amenities in the new home to buy-down the mortgage rate to 4 percent or below. New home activity will not be impacted, but existing home listings will have a disadvantage unless sellers are willing to contribute toward points to also buy down the rate. Dust off your playbook as to how this works so you don’t lose a sale in 2018. Home-price appreciation is strong and ran above 6 percent in 2017. It will remain strong (above 5 percent) in 2018 despite signs that more inventory is going to be put in the ground during the spring 2018 months.”

The Lake Martin Waterfront Residential Monthly Report is developed in conjunction with the Lake Martin Area Association of Realtors to better serve area consumers.


Lake Martin waterfront sales for November increase strongly from last year

By: ACRE Research

Sales: Lake Martin waterfront sales totaled 23 units during November, a 76.9 percent increase from the same period in 2016. Sales for November 2016 on Lake Martin’s waterfront totaled 13 units. Year-to-date sales on the waterfront are up 14.4 percent from the same period in 2016.

Supply: The Lake Martin waterfront housing inventory in November was 189 units, a decrease of 16.4 percent from November 2016 and 64.4 percent below the November peak in 2008 of 531 units. November inventory decreased by 8.2 percent from September.

Pricing: The Lake Martin waterfront median sales price during November was $437,000, an increase of 19.7 percent from November 2016 and an increase of 9.3 percent from the prior month. Pricing will fluctuate from month to month because of changing composition of actual sales (lakefront vs. non-lakefront) and the sample size of data (closed transactions) being subject to seasonal buying patterns. ACRE recommends contacting a local real estate professional for additional market pricing information.

Industry analysis: “The economy and real estate markets continue to show they are resilient. Regardless of the economic metric — GDP, monthly jobs or home prices — the dashboard registers an ‘all-systems-go’ economy,” said KC Conway, director of research and corporate engagement at the Alabama Center for Real Estate. “GDP started the year off with its best Q1 reading in several years and followed it up with above 3 percent readings for Q2 and Q3. (This year) will be the first year since the financial crisis that the economy registered an annual GDP greater than 2 percent. It was just plus 1.6 percent for 2016.

“Job growth is healthy as well. The first week of December the market received solid monthly jobs reports from both ADP (which measures private industry job formation) and the BLS (the government’s monthly jobs report produced by the Bureau of Labor Statistics). ADP reported a healthy new 190,000 private-sector jobs for November and a monthly average of 210,000 jobs over the prior 12 months. The BLS reported November jobs at a higher-than-expected level of 228,000 jobs – and its year-to-date monthly average is 174,000. Unemployment remains low at 4.1 percent, and inflation was just reported on December 13th at 1.7 percent for the “core rate” (which excludes the more volatile food and energy components) and 2.2 percent overall annualized due to higher energy prices.

“The Federal Reserve is taking note of the expanding economy and followed up its prior two rate hikes earlier in 2017 with a 0.25 percent rate increase at its December 13th meeting. Housing conditions remain conducive to growth in new supply and more transaction activity. Single-family home inventories are below demand levels across the nation, Southeast and most Alabama markets. The national rate of appreciation is running above 6 percent on the heels of 5-plus percent in 2016. This is leading builders and lenders to be more receptive to adding inventory. New housing starts and permits will likely end 2017 at or above the 1.3 million units level, split 30 percent multifamily and 70 percent single-family. The outlook heading into 2018 is the best we have seen in a decade.”

The Lake Martin Waterfront Residential Monthly Report is developed in conjunction with the Lake Martin Area Association of Realtors to better serve area consumers.

Lake Martin waterfront sales up over the past year

lake martin marina

By: Bryan Davis

The Lake Martin waterfront median sales price during August was $421,000, an increase of 15.3 percent from August 2016.

Click here to view or print the entire monthly report compliments of the ACRE Corporate Cabinet.

Sales: Lake Martin waterfront sales totaled 37 units during August, a 23.2 percent increase from the same period in 2016. Sales for August 2016 on Lake Martin’s waterfront totaled 30 units. It is important to note that even single-digit changes in the home sales total can cause double-digit percentage changes.

lake martin graph

Supply: The Lake Martin waterfront housing inventory in August was 247 units, a decrease of 6.8 percent from August 2016 and 44.7 percent below the July peak in 2010 of 447 units. August inventory decreased by 33.2 percent from July. There were 6.7 months of housing supply in August (6 months is considered equilibrium).

Pricing: The Lake Martin waterfront median sales price during August was $421,000, an increase of 15.3 percent from August 2016 and 4.3 percent below the prior month. Pricing will fluctuate from month to month because of changing composition of actual sales (lakefront vs. non-lakefront) and the sample size of data (closed transactions) being subject to seasonal buying patterns. ACRE recommends contacting a local real estate professional for additional market pricing information.

Industry analysis: “For the first time in 2017, we have increased our full-year growth outlook. The upgrade reflects economic activity gaining momentum at the end of the second quarter, though we see a great deal of uncertainty surrounding the forecast,” said Fannie Mae Chief Economist Doug Duncan. “The list of uncertainties now extends beyond the geopolitical and legislative, as the effects of Hurricanes Harvey and Irma will require time to untangle. Historically, natural disasters that hit heavily populated areas led to substantial near-term declines in economic activity but meaningful rebounds in subsequent quarters due to rebuilding efforts. Thus, economic growth in the second half of 2017 could still average a slightly stronger pace than the first half. Unfortunately, we continue to expect home sales to be flat during the second half of the year compared to the first half due to strong home price appreciation and lean inventories.”

Lake Martin waterfront home sales improved in September

lake martin waterfront sales

By: Bryan Davis

Click here to view or print the entire monthly report compliments of the ACRE Corporate Cabinet.

Sales: Lake Martin waterfront sales totaled 37 units during September, unchanged from the same period in 2015. Year-to-date sales on Lake Martin’s waterfront are 11 percent below the same period a year ago. It is important to note that even single-digit changes in the home sales total can cause double-digit percentage changes.

Supply: The Lake Martin waterfront housing inventory in September was 257 units, a decrease of 17 percent from September 2015 and 51 percent below the September peak in 2009 of 526 units (this is good news). September inventory also decreased by 3 percent from August. This direction is consistent with historical data indicating that September inventory on average (2011-15) decreases from August by 7.2 percent. There were 6.9 months of housing supply in September (6 months is considered equilibrium).

Demand: Waterfront residential sales increased 23 percent during September, from 30 units sold in August. Historical seasonal patterns indicate September sales on average (2011-15) decrease by 16.6 percent from August.

Pricing: The Lake Martin waterfront median sales price during September was $440,000, an increase of 13 percent from September 2015 and an increase of 20.5 percent from the prior month. Pricing will fluctuate from month to month due to changing composition of actual sales (lakefront vs. non-lakefront) and the sample size of data (closed transactions) being subject to seasonal buying patterns. ACRE recommends contacting a local real estate professional for additional market pricing information.

The Lake Martin Waterfront Residential Monthly Report is developed in conjunction with the Lake Martin Area Association of Realtors to better serve area consumers.